[et_pb_section bb_built=”1″ fullwidth=”on” specialty=”off” next_background_color=”#000000″ _builder_version=”3.11.1″ global_module=”150″][et_pb_fullwidth_slider admin_label=”Header” global_parent=”150″ _builder_version=”3.11.1″][et_pb_slide _builder_version=”3.11.1″ button_link=”#” background_color=”#7EBEC5″ use_background_color_gradient=”off” background_color_gradient_start=”#2b87da” background_color_gradient_end=”#29c4a9″ background_color_gradient_type=”linear” background_color_gradient_direction=”180deg” background_color_gradient_direction_radial=”center” background_color_gradient_start_position=”0%” background_color_gradient_end_position=”100%” background_color_gradient_overlays_image=”off” parallax=”on” parallax_method=”on” background_size=”cover” background_position=”center” background_repeat=”no-repeat” background_blend=”normal” allow_player_pause=”off” background_video_pause_outside_viewport=”on” use_bg_overlay=”off” use_text_overlay=”off” text_border_radius=”3″ alignment=”center” child_filter_hue_rotate=”0deg” child_filter_saturate=”100%” child_filter_brightness=”100%” child_filter_contrast=”100%” child_filter_invert=”0%” child_filter_sepia=”0%” child_filter_opacity=”100%” child_filter_blur=”0px” child_mix_blend_mode=”normal” background_layout=”dark” text_shadow_style=”preset3″ header_text_shadow_style=”preset3″ body_text_shadow_style=”none” custom_button=”off” button_bg_use_color_gradient=”off” button_bg_color_gradient_overlays_image=”off” button_use_icon=”on” button_on_hover=”on” button_text_shadow_style=”none” box_shadow_style_button=”none” background_image=”http://cumberlandconsulting.com.au/wp-content/uploads/2019/02/header-bg.jpg” text_shadow_horizontal_length=”0em” text_shadow_vertical_length=”0em” text_shadow_blur_strength=”0.5em” header_text_shadow_horizontal_length=”0em” header_text_shadow_vertical_length=”0em” header_text_shadow_blur_strength=”0.5em” body_text_shadow_horizontal_length=”0em” body_text_shadow_vertical_length=”0em” body_text_shadow_blur_strength=”0em” button_text_shadow_horizontal_length=”0em” button_text_shadow_vertical_length=”0em” button_text_shadow_blur_strength=”0em” heading=”Leading People To Business Excellence” text_shadow_color=”rgba(0,0,0,0.75)” custom_padding_tablet=”2em||2em|” custom_padding_phone=”2em||2em|” custom_css_main_element=”min-height: 56.25vh;” body_font_size_last_edited=”off|” header_text_shadow_color=”rgba(0,0,0,0.76)” header_text_align=”center” body_text_align=”center” body_font_size=”14″ body_font_size_tablet=”12″ body_font_size_phone=”12″]

We believe that leaders in any type of organisation need to understand where they are leading the organisation, what culture they need to have to optimise the organisation’s effectiveness and which leaders fit and what can be done to develop them to their full potential.

[/et_pb_slide][/et_pb_fullwidth_slider][/et_pb_section][et_pb_section bb_built=”1″ fullwidth=”off” specialty=”off” prev_background_color=”#000000″ next_background_color=”rgba(6,20,50,0.75)”][et_pb_row][et_pb_column type=”4_4″][et_pb_text admin_label=”Client Benefits of our Experience” _builder_version=”3.11.1″]

Client Benefits of our Experience

[/et_pb_text][et_pb_text _builder_version=”3.11.1″]

Objectively evaluating the benefits of our work is a challenge, as much of what we do is often viewed as intangible. At Cumberland, we aim to evaluate our projects wherever possible. This focus on evaluating the level of success of a project and the Return on Investment (ROI) we believe is unique and underpins our focus on learning and our philosophy of always believing we can do it better.

Quantifying results in dollar terms is important and the research below provides solid evidence for the benefits that can be obtained. Several researchers have found the use of sophisticated Human Resource systems to have a significant impact on the financial returns of an organisation.

Sophisticated Human Resource Systems
In one study of 968 firms it was found that increasing the sophistication of Human Resource practices by one standard deviation (including Recruitment/Selection, Performance Management, Remuneration, Grievance Procedures, Information Sharing, Empowerment Strategies and Assessment of Attitudes) led to an increase in profit per employee of US$7,868 per annum and in the market value of the firm of US$33,250 per employee

This means that developing sophisticated Human Resource practices for an organisation with 300 people, has a potential return in profitability of up to $2.36M ($7,868 x 300 employees) and an increase in market value of up to $9.98M ($33,250 x 300).

[/et_pb_text][/et_pb_column][/et_pb_row][/et_pb_section][et_pb_section bb_built=”1″ specialty=”off” prev_background_color=”#ffffff” next_background_color=”#ffffff” _builder_version=”3.11.1″ background_color=”rgba(6,20,50,0.75)” top_divider_style=”slant2″ bottom_divider_style=”slant2″ bottom_divider_flip=”horizontal”][et_pb_row][et_pb_column type=”4_4″][et_pb_text admin_label=”Culture” _builder_version=”3.11.1″ background_layout=”dark”]

Culture

[/et_pb_text][et_pb_text _builder_version=”3.11.1″ background_layout=”dark”]

In another study of 175 organisations, it was found that corporate culture can have a significant impact on a corporation’s long-term economic performance. The researchers found that organisations with strong cultures outperformed those with weaker culture over an eleven year period. Below presents a summary of their findings.

[/et_pb_text][/et_pb_column][/et_pb_row][et_pb_row _builder_version=”3.11.1″][et_pb_column type=”4_4″][et_pb_text admin_label=”Strong Culture” _builder_version=”3.11.1″ background_layout=”dark”]

Strong Culture

[/et_pb_text][/et_pb_column][/et_pb_row][et_pb_row][et_pb_column type=”1_4″][et_pb_number_counter admin_label=”Increase Revenues” _builder_version=”3.11.1″ title=”Increase Revenues” number=”682″ number_text_color=”#ed7317″ background_layout=”dark” /][/et_pb_column][et_pb_column type=”1_4″][et_pb_number_counter admin_label=”Expanded Workforce” _builder_version=”3.11.1″ title=”Expanded Workforce” number=”282″ number_text_color=”#ed7317″ background_layout=”dark” /][/et_pb_column][et_pb_column type=”1_4″][et_pb_number_counter admin_label=”Growth in Stock Price” _builder_version=”3.11.1″ title=”Growth in Stock Price” number=”901″ number_text_color=”#ed7317″ background_layout=”dark” /][/et_pb_column][et_pb_column type=”1_4″][et_pb_number_counter admin_label=”Improved net incomes” _builder_version=”3.11.1″ title=”Improved net incomes” number=”756″ number_text_color=”#ed7317″ background_layout=”dark” /][/et_pb_column][/et_pb_row][et_pb_row _builder_version=”3.11.1″][et_pb_column type=”4_4″][et_pb_text admin_label=”Weak Culture” _builder_version=”3.11.1″ background_layout=”dark”]

vs Weak Culture

[/et_pb_text][/et_pb_column][/et_pb_row][et_pb_row _builder_version=”3.11.1″][et_pb_column type=”1_4″][et_pb_number_counter admin_label=”Increase Revenues” _builder_version=”3.11.1″ title=”Increase Revenues” number=”166″ number_text_color=”#ed7317″ background_layout=”dark” number_font_size=”36″ number_line_height=”36px” title_level=”h5″ custom_css_percent=”height: auto;” /][/et_pb_column][et_pb_column type=”1_4″][et_pb_number_counter admin_label=”Expanded Workforce” _builder_version=”3.11.1″ title=”Expanded Workforce” number=”36″ number_text_color=”#ed7317″ background_layout=”dark” number_font_size=”36″ number_line_height=”36px” title_level=”h5″ custom_css_percent=”height: auto;” /][/et_pb_column][et_pb_column type=”1_4″][et_pb_number_counter admin_label=”Growth in Stock Price” _builder_version=”3.11.1″ title=”Growth in Stock Price” number=”74″ number_text_color=”#ed7317″ background_layout=”dark” number_font_size=”36″ number_line_height=”36px” title_level=”h5″ custom_css_percent=”height: auto;” /][/et_pb_column][et_pb_column type=”1_4″][et_pb_number_counter admin_label=”Improved net incomes” _builder_version=”3.11.1″ title=”Improved net incomes” number=”1″ number_text_color=”#ed7317″ background_layout=”dark” title_level=”h5″ number_font_size=”36″ number_line_height=”36px” custom_css_percent=”height: auto;” /][/et_pb_column][/et_pb_row][et_pb_row][et_pb_column type=”4_4″][et_pb_text _builder_version=”3.11.1″ /][/et_pb_column][/et_pb_row][/et_pb_section][et_pb_section bb_built=”1″ fullwidth=”off” specialty=”off” prev_background_color=”rgba(6,20,50,0.75)” next_background_color=”#000000″][et_pb_row][et_pb_column type=”4_4″][et_pb_text admin_label=”Selection and development of people” _builder_version=”3.11.1″]

Selection and development of people

[/et_pb_text][et_pb_text _builder_version=”3.11.1″]

Another paper from another team of researchers presents a culmination of 85 years of research into the validity and utility of selection practices. The findings link employee job performance, as a dollar value of output, to the annual salary. Specifically, one standard deviation in job performance represents 40% of annual salary. Thus, an above average employee who earns $50,000 will produce $20,000 more in output than an average employee on the same money. These figures are considered conservative.

What does this mean? Employing or developing above average workers will add up to 40% more output for the same wage bill. Cumberland’s approach to building sophisticated selection systems and development of people can help your business derive some or all of these benefits.

SHORTLIST© (Cumberland’s Values Selection Tool)
At Cumberland we continue to research and evaluate the effectiveness of our solutions and SHORTLIST© is no exception. We have undertaken several evaluations to gain an understanding of how effective SHORTLIST© is to our clients. The following case study illustrates the effectiveness of our approach.

USING SHORTLIST© AS A SELECTION TOOL IN THE EXPANSION OF AN EXISTING MINE – “GOPHER MINE”

[/et_pb_text][et_pb_text admin_label=”The Scenario” _builder_version=”3.11.1″]

The Scenario

[/et_pb_text][et_pb_text _builder_version=”3.11.1″]

The Board of Gopher Mine approved the go ahead for a major expansion of their current operations. This involved the construction of a new 1.5 million tonnes per annum processing plant, a new underground mine and a new accommodation facility 60 kilometres from the original site. Approximately 100 new employees would also have to be recruited for this expansion. One of the key issues was the possibility that such rapid growth in employee numbers would destroy the very positive culture that had been established. Growth brings change and Gopher Mine was not keen to lose the small company ethic. The management team clearly recognised that the continuation and enhancing of the positive culture was critical to the ongoing success of their mining operations. Introducing 100 new employees from a range of other operations and workplace cultures into the established culture posed some risk.
The dilemma facing Gopher Mine was how to:

  • Define the current workplace culture?
  • Measure its impact on the operations?
  • Continue to improve safety in a larger operation?
  • Recruit people who would fit in to existing workplace culture?
  • Know if they had been successful in all these areas?
  • Assess the effect on the bottom line?

Cumberland was asked to assist and using our SHORTLIST© tool created a selection system to recruit the new employees. 1100 candidates were screened on their fit to the organisation’s culture (values scores) and their fit to the job (competencies scores). The effectiveness of our approach is detailed below

Recruiting People Who Will Fit into the Gopher Mine’s Culture

  • Total SHORTLIST© values scores were significant predictors of final selection (p<.0001)
  • Total SHORTLIST© competency scores were significant predictors of final selection (p<.0001)

Recruiting People Who Will Perform in the Gopher Mine’s Culture

Performance ratings twelve months after recruitment indicated that

  • 85% of those selected were performing at or above the expected level
  • 60% of those selected were performing in the top quartile on a range defined from well below expected standard to well above expected standard

[/et_pb_text][et_pb_text admin_label=”Impact on Safety” _builder_version=”3.11.1″]

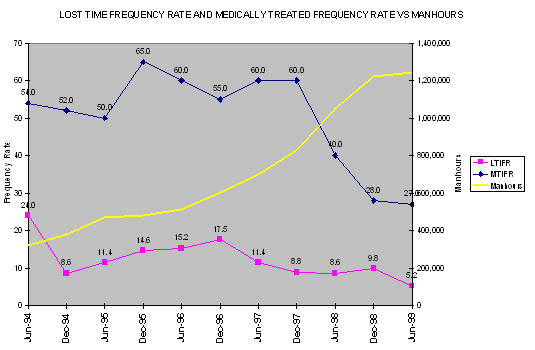
Impact on Safety

[/et_pb_text][et_pb_image _builder_version=”3.11.1″ src=”http://cumberlandconsulting.com.au/wp-content/uploads/2019/02/safety-impact.gif” align=”center” border_width_all=”1px” show_bottom_space=”off” /][et_pb_text admin_label=”Image Figure 1 Text” _builder_version=”3.11.1″ text_font_size=”10px”]

Figure 1 – Lost Time and Medically Treated Frequency Rates Versus Man-Hours

[/et_pb_text][et_pb_text _builder_version=”3.11.1″]

Figure 1 shows the increase in man-hours that resulted from the expansion at Gopher Mine which began around February 1998. Typically it would be expected that the Lost Time Injury Frequency rate and the medically treated frequency rate would rise in a corresponding trend. As the graph shows, there is a gradual decline in the lost time frequency rate and a sharp decline in the medically treated frequency rates.

There were a number of initiatives to address safety around this period beginning February 1998 but the impact of bringing people into Gopher Mine that already had values in tune with those of Gopher Mine and reinforcing those values clearly enhanced the success of those initiatives.

[/et_pb_text][/et_pb_column][/et_pb_row][/et_pb_section][et_pb_section bb_built=”1″ specialty=”off” prev_background_color=”#ffffff” _builder_version=”3.11.1″ background_image=”http://cumberlandconsulting.com.au/wp-content/uploads/2019/02/contact-us-bg2-2.jpg” top_divider_style=”mountains” background_position=”bottom_center” global_module=”151″][et_pb_row global_parent=”151″ _builder_version=”3.11.1″ module_alignment=”center” make_equal=”on” module_class_1=”ds-vertical-align” module_class_2=”ds-vertical-align” module_class_3=”ds-vertical-align”][et_pb_column type=”1_4″][et_pb_blurb global_parent=”151″ _builder_version=”3.11.1″ title=”0409 433 472″ use_icon=”on” font_icon=”%%264%%” use_circle=”on” circle_color=”#ffffff” text_orientation=”center” background_layout=”dark” header_text_shadow_style=”preset3″ header_text_shadow_blur_strength=”0.5em” header_text_shadow_color=”rgba(0,0,0,0.75)” /][/et_pb_column][et_pb_column type=”1_2″][et_pb_contact_form global_parent=”151″ _builder_version=”3.11.1″ title=”Contact Us” success_message=”Thank you, we will be in contact shortly” title_text_color=”#ffffff” custom_css_captcha_label=”color: white;||text-shadow: 0em 0em 0.5em rgba(0,0,0,0.7);”][et_pb_contact_field field_title=”Name” field_type=”input” field_id=”Name” required_mark=”on” fullwidth_field=”off” /][et_pb_contact_field field_title=”Email Address” field_type=”email” field_id=”Email” required_mark=”on” fullwidth_field=”off” /][et_pb_contact_field field_title=”Message” field_type=”text” field_id=”Message” required_mark=”on” fullwidth_field=”on” /][/et_pb_contact_form][/et_pb_column][et_pb_column type=”1_4″][et_pb_blurb global_parent=”151″ _builder_version=”3.11.1″ title=”PO Box 2020, Marmion, Western Australia 6020″ use_icon=”on” font_icon=”%%238%%” use_circle=”on” circle_color=”#ffffff” text_orientation=”center” background_layout=”dark” text_shadow_style=”preset3″ text_shadow_blur_strength=”0.5em” text_shadow_color=”rgba(0,0,0,0.75)” /][/et_pb_column][/et_pb_row][/et_pb_section]